
Peak Spotting
Peak Spotting provides federal train yield and capacity managers with rich visual tools to identify potential bottlenecks.
-
Cooperation with
Moritz Stefaner and Studio NAND (Stephan Thiel, Gabriel Credico, Lennart Hildebrandt)
-
Role
Interaction Designer
-
Client
Deutsche Bahn AG
Intro
The Deutsche Bahn acquired Moritz Stefaner to support them produce an analytic tool to visualize train capacity predictions and to act on them. He started with workshops and created a first working prototype to help tackle their challenges. You can read more about his process on his project documentation. I had the pleasure to support him with interaction and interface design. I worked on the information architecture, developed UI components to support the user perform their tasks as good as possible and work on the overall visual appearance of the tool.
Design Process
-
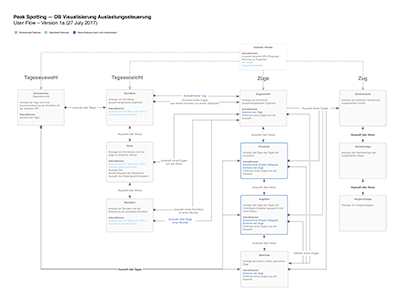
Information Architecture
I jumped on the project when a fully working prototype already existed, that made it easier to work on the information architecture and how the components should play together.
-
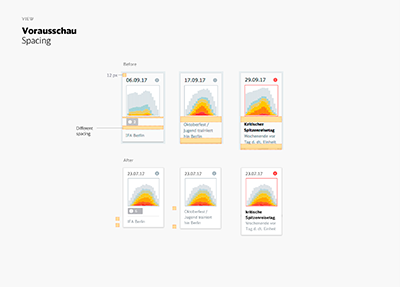
Screen Design
During the process, the initial components were reworked with the help of user feedback and new components were designed.
-
Iterative design and development
We worked close with the great developers of Studio NAND. We exchanged feedback to improve the user experience and performance of the tool.
-
User Feedback
The application is currently in test use. We will interview the users to plan new features and to improve old ones.
Design Details
-
Overall Design
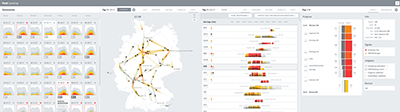
We created an overall design framework that helps analysts to find trains that need actions. We iterated through various design solutions to find the easiest way to access certain trains.
-
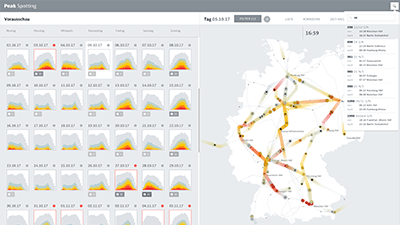
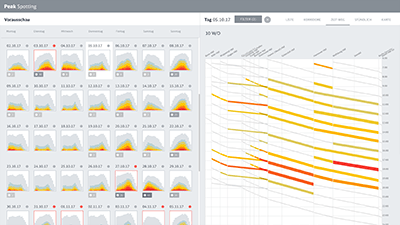
User Interfaces
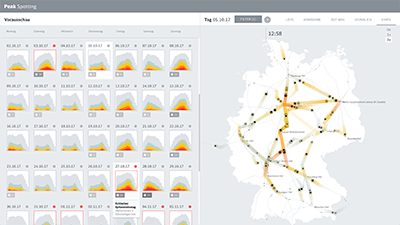
The daily previews and additional annotations support the analyst to select the right day
A global search, which also works with shortcuts, facilitates navigation
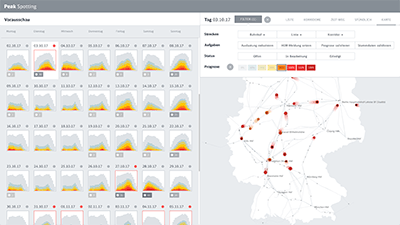
Global filters can be used to personalize the views
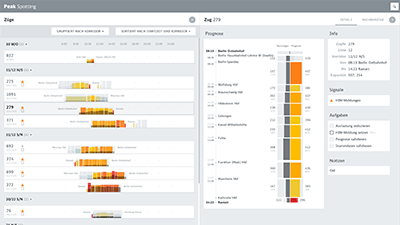
Grouping trains helps to speed up daily work
Media Coverage
The Data Viz That’s Helping Transform A $45 Billion Company
Learnings
The cooperation with Christian Au, our main contact person, was great. I learned how important it is to have a client who shares the same vision. Furthermore, the collaboration with Moritz Stefaner and Studio NAND was very enlightening. It was really interesting to see how they approach such a project. It was especially good to see how Moritz conducted workshops and early prototyping to find fitting solutions that were improved by iterations.